COVID-19 diagnoses in Atlanta and Sandy Springs continued to rise this week, according to Fulton County Board of Health statistics.
In numbers, Atlanta had 1,271 confirmed cases as of April 29. That was up from 1,212 on April 27 and 1,026 on April 22.
Sandy Springs had 218 confirmed cases as of April 29. That was up from 207 on April 27 and 176 on April 22.
The statistics aren’t as accurate as they look due to such factors as a large number of patients whose cities or ZIP codes are unknown, and it remains unclear whether the rise reflects an increase in the coronavirus’s spread, an increase in testing, or both. But the numbers in the April 29 report paint a broad picture that puts Atlanta at number one and Sandy Springs at number three among the county’s total COVID-19 cases.
The report’s numbers are based on the home address of people diagnosed with COVID-19, according to Fulton government spokesperson Jessica Corbitt.
The part of Atlanta within Fulton had 45.4% of the county’s cases that could be identified by address. Sandy Springs had 7.8%. Number two was the city of South Fulton at 12.4%.
However, the home city of the patient was unknown in 370 of Fulton’s total cases, or 13.2% of the total. In addition, the report says, a few cases may shift from one city to another between reports due to “data cleaning.”
A breakdown of cases by ZIP code gives a closer look at Sandy Springs’ figures and gives some numbers for the Buckhead neighborhood within Atlanta. The numbers from some local ZIP codes, and their increase from April 27, are as follows:
Buckhead ZIP codes
30305: 47 (up from 46)
30326: 15 (no change)
Sandy Springs ZIP codes
30328: 56 (up from 53)
30350: 53 (up from 48)
Buckhead and Sandy Springs combined ZIP codes
30327: 60 (up from 58)
30342: 118 (up from 114)
Again, those numbers may not be accurate, because the ZIP codes are unknown for 212 of the county’s cases, or 7.6% of the total.
In terms of COVID-19 diagnoses by population density, Atlanta and Sandy Springs are lower in the pack than south Fulton cities. Atlanta’s rate is roughly 288 diagnoses per 100,000 people, based on 2018 U.S. Census estimates, and Sandy Springs’ is roughly 207 per 100,000.
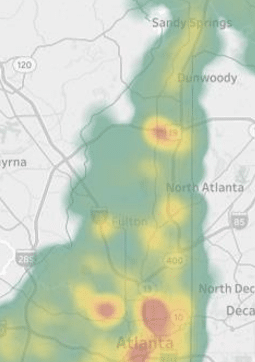
However, by another measure — cases per 1,000 people within Census tracts — Buckhead and Sandy Springs have some of the county’s highest densities of diagnoses. Tracts where the density is equal to or less than 9.4 cases per 1,000 — the highest category on the report’s map — include areas in northern and western Buckhead, and the area of Roswell Road and I-285 in Sandy Springs.
That same Census tract in Sandy Springs includes the Medical Center area with the major hospitals Northside, Emory Saint Joseph’s and Children’s Healthcare of Atlanta Scottish Rite. But hospital locations do not count as addresses. The density calculation also does not include cases in long-term care facilities, according to the report.
In terms of outcomes for people diagnosed so far with COVID-19 in Fulton, the report says, 3.9% died; 18.3% were hospitalized; 5.1% were admitted to an intensive care unit; and 2.8% required assisted ventilation.
To view the current and previous editions of the report, see the county website here.